Monitoring K8s With Prometheus Running On Federated Mode Integrated With Thanos

In this article, let’s see how prometheus running on federated mode together with thanos and monitor multiple k8s clusters. If you would like to watch the live webinar session of this; feel free to check out the below link >> https://youtu.be/h369W9SMQfk
And also let’s try to deploy thanos along with prometheus and grafana to kubernetes clusters by using helm charts.
Thanos is a popular solution to providing a distributed high availability, global quality view of metrics and long-term storage for prometheus. With the expansion of prometheus, instrumented to kubernetes clusters; some limitations come to our picture.
How to query metrics across multiple clusters?
- Metric view from a single pane of a glass : Just imagine you deployed prometheus on 50 clusters, and you don’t want to jump between prometheus instance to query metrics for each cluster.
- Long-term metric storage : How do we store metrics for long-term by default. As we all know prometheus has a retention of 15 days by default; so if I ingest some metrics, those samples are kept in tsdb for 15 days by default. The question remains, what if I want to query data from several months ago.
- High Availability (HA) : What if for any number of reasons prometheus goes down; what happens to our entire metric system.
Thanos was born to overcome those issue, the whole point of thanos is try to combat some of these issues; that we can see when we scaling prometheus globally, when we’re scrubbing from hundreds of thousands of different clusters. And at its core thanos consist of number of composable components; that we can use to bring scalability, high-availability (HA), long-term retention on top of any existing prometheus setup.
Thanos is completely prometheus compatible, it’s built on top of all of the great design principles of prometheus to leverage all of the knowledge of running prometheus.
It provides a global view of metrics, where we can see metrics from all over different clusters.
And also we will have long-term retention, so we can query those metrics from several years ago from all of our clusters. But also we’ll be able to see data down to the individual sample; even if like a year ago.
Kubernetes Together With Prometheus Architecture

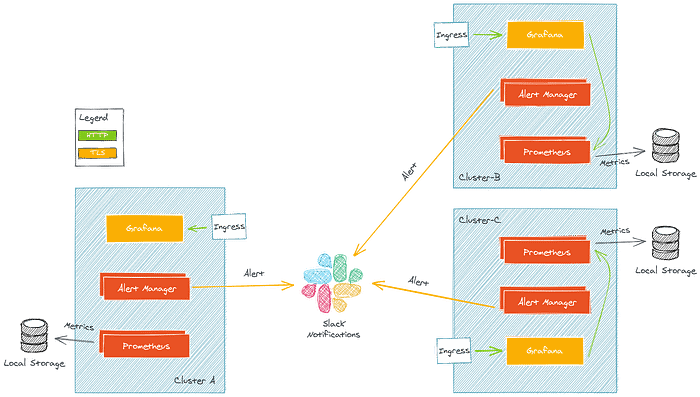
As you can see in the above architecture; we have three separated clusters as labeled Cluster-A, Cluster-B and Cluster-C. In each cluster successfully installed prometheus, alert-manager and grafana. And also we have a notification provider; this architecture used Slack, you can use any other notification provider such as Google chat, MS teams and etc.
When deploying kubernetes infrastructure for our customer, it is standard to deploy a monitoring stack on each cluster. This stack is often to comprise of several components;
Prometheus: For collect metrics.
AlertManager: For send alerts to various provider based on metrics query.
Grafana: Simply for fancy dashboards.
When we move on to the real architecture of thanos, please have a look at the below architecture.
Real Architecture Of Thanos

As you can see in this above architecture, pretty similar to the previous one; we have three separated clusters as labeled, previous one. And each cluster successfully installed prometheus with something called thanos sidecar, thanos compactor and alert-manager. Only in cluster-A installed grafana and also we have three separated object stores connected to each cluster.
So, thanos follows the similar idea; thanos querier and which is the key entrance of the middleware, the client doesn’t query prometheus directly anymore, instead the requests are sent to query first and querier deals with each of distributed prometheus instance via GRPC interface called a Store API to aggregates data which means collect data and presents back to clients.
All the Store API does is to expose the distributed data. So, when speaking of data the most important one is the local storage. In each prometheus cluster is exposed by sidecar.

So, this Sidecar is able to read the data on disk and thanos querier calls Store API in the GRPC interface to collect data.
So, as you can see the above Thanos Architecture different components talks to each other via Store API as well. Hence all components possibly send data to the remote object storage directly.
To watch the full demo of this deployment; please visit the Kubernetes Sri Lanka YouTube Channel and watch this video >> https://youtu.be/h369W9SMQfk
Git Repo: https://git.io/JW17a
Don’t forget to hit the Subscribe button for Kubernetes Sri Lanka Channel.
Thank you. Stay Safe.
